How to Use Custom Metrics in Facebook Ads Automated Rules
August 30, 2023
Regular metrics are often not enough to measure ad performance. Learn how to create custom metrics on AR and use them to automate ad management.
If you have some experience with digital advertising, you’re well aware of the fact that the success of ad campaigns hinges on the ability to harness data-driven insights and leverage advanced tools for optimal decision-making. It's no longer enough to merely create ads and launch campaigns: the true competitive advantage lies in an advertiser’s ability to track and use data to identify opportunities for optimization and adapt strategies in real-time.
One of the most important tasks of this process is tracking performance metrics that allow you to objectively evaluate the progress of your ad campaigns and improve their results. Fortunately, many advertising platforms nowadays offer the necessary tools for doing this – like Facebook, for example.
Meta Ads Manager provides a wide variety of metrics that can help advertisers track their ad performance via the Ads reporting feature. There are different categories of metrics available for this feature that can cover all of your basic ad reporting needs.
To check the available metrics, we can open our Ads Manager, click on the “Columns” dropdown, then select “Customize columns”: here, we’ll see what metrics we can use for our performance reports.
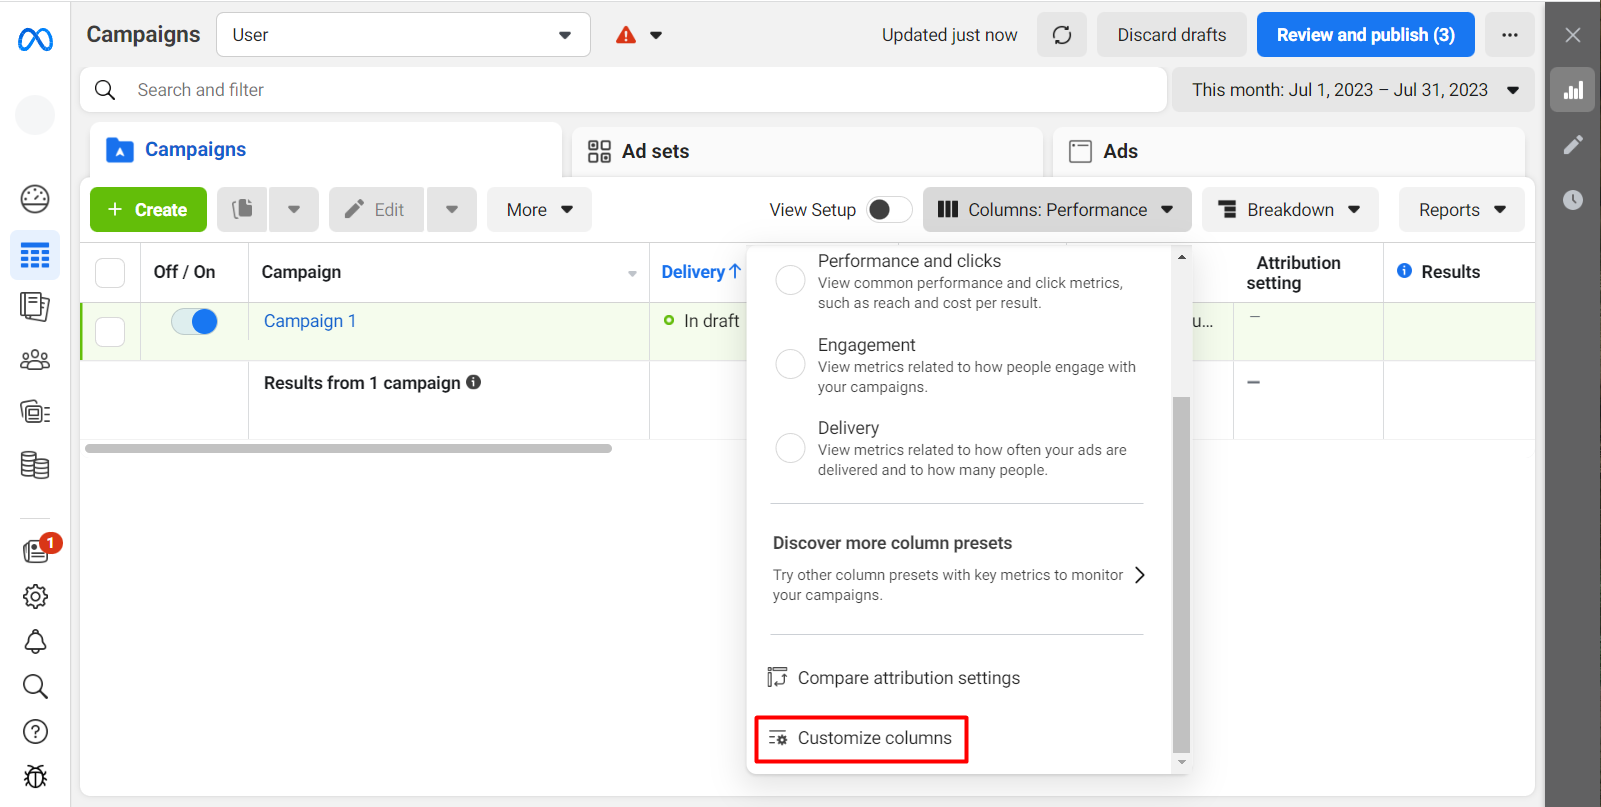
The “Customize columns” option allows you to select which metrics you’ll be tracking for your Ads reporting.
For many advertisers, however, the default metrics might not be enough for truly effective performance tracking. Luckily, the Ads Manager provides an opportunity to create our own custom metrics based on specific campaign goals and business objectives.
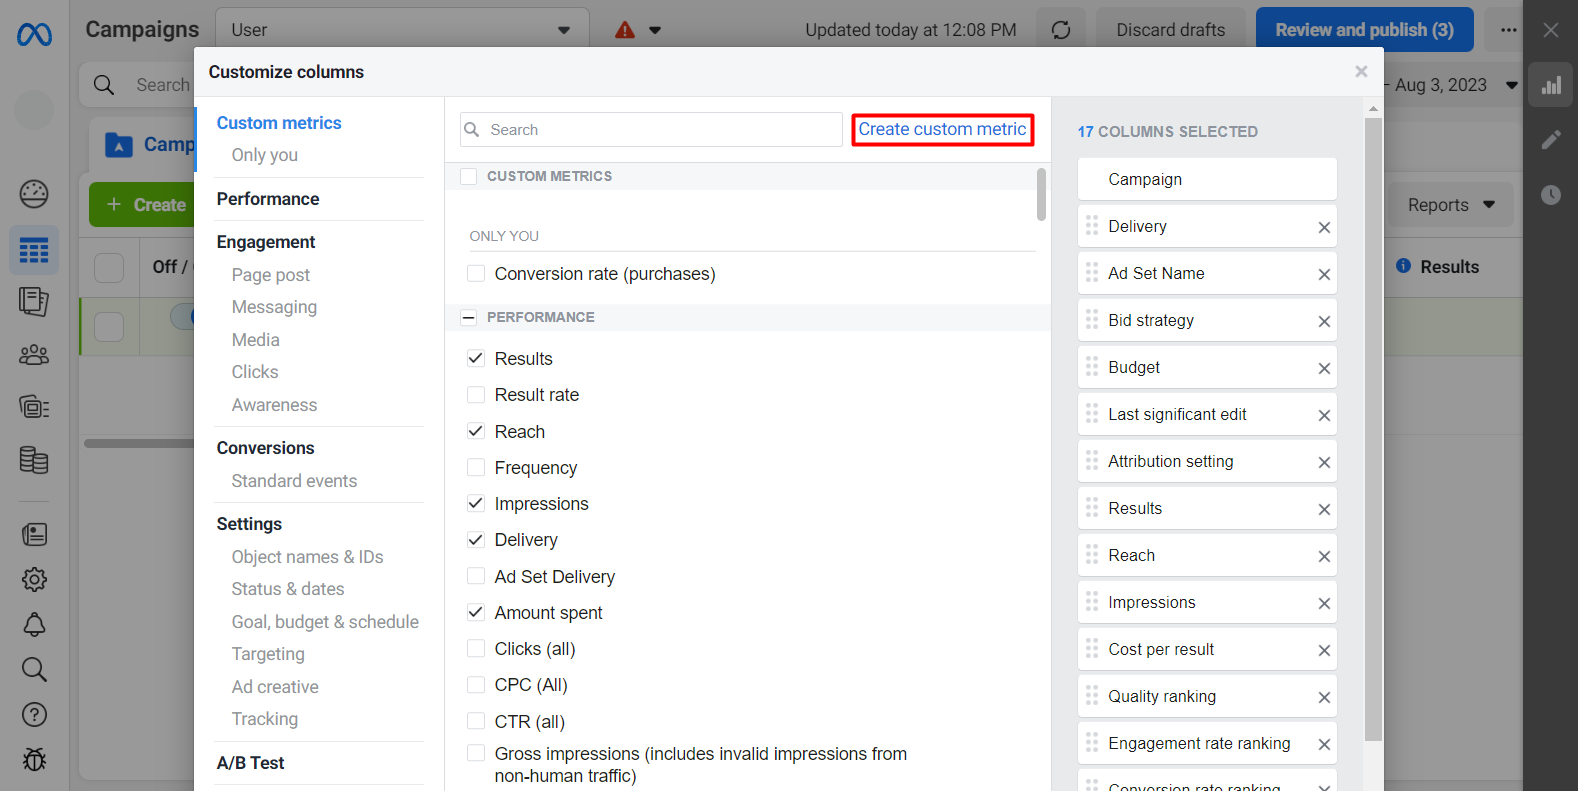
Besides standard metrics, you can also create your own custom metrics in the Meta Ads Manager.
Custom metrics are usually created by using the already existing metrics: with the help of mathematical operators, they are assembled together into a formula for calculating specific performance indicators we’re going to track.
Here are just some benefits of using custom metrics for digital advertising:
- Tailored performance measurement: standard metrics may not always correctly reflect the performance of our campaigns, while custom metrics allow us to solve this problem by creating KPIs tailored for specific cases.
- Holistic insights: custom metrics enable us to get a more comprehensive view of how our campaigns are doing by measuring different aspects of ad performance.
- Advanced optimization: optimization strategies often require custom metrics for analyzing performance from a specific angle and making decisions backed by highly accurate data.
It’s important to note that in the Ads Manager, custom metrics can be used for Ads reporting only. Unfortunately, if you're using automated rules for managing your ads more effectively, you won't be able to use custom metrics for making your rules more tailored to specific campaigns, which can be a problem even with a variety of default metrics available.
Luckily, this problem is easily solvable with third-party tools like AutomatedRules. By using this tool, you can reduce your workload as you won't have to manually calculate your custom metrics and optimize your ads based on them – everything will be done automatically and within a single interface.
In this article, we’ll show you how to create custom metrics in the AutomatedRules interface and list KPIs that you might want to use for managing and optimizing your Facebook ads more effectively.
Creating custom metrics with AutomatedRules
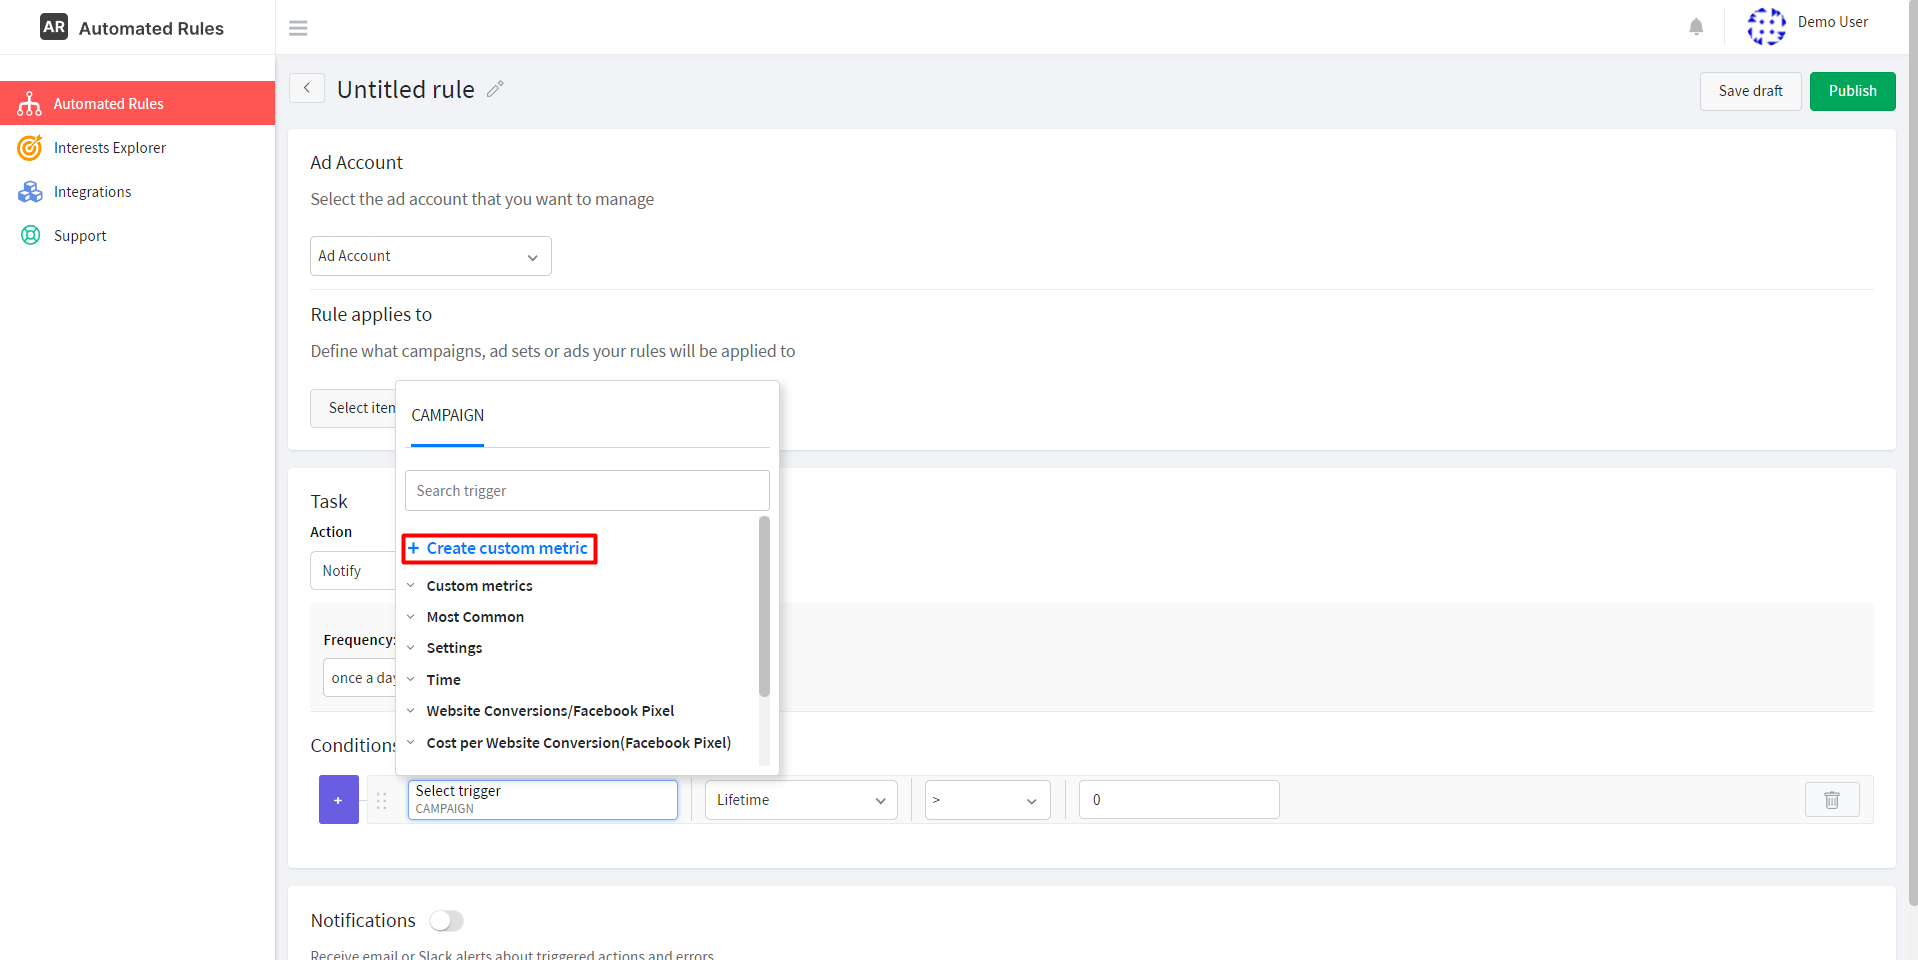
To create a custom metric on AutomatedRules, first, we need to choose the platform we want to create rules for – in this case, Facebook. Once we do that, we can click + Create rule, proceed to the Conditions section, click Select trigger, and then + Create custom metric.
Next, we’ll need to fill in the following details about our metric:
- The name: it’s better to choose a short but descriptive name that will help you instantly recognize your metric;
- The format: a metric can be expressed as a number, a percentage, or a sum of money;
- The description: displayed when you hover your mouse over the “i” icon, it will allow you to easily see what exactly is measured by this metric;
- The formula, or the most important part of the metric.
The algorithm for creating the formula for your metric is pretty straightforward:
- Select the first metric from the “metric” drop-down list,
- Choose the time range within which this metric will be checked, the metric format (number, money, or percentage), and click Add,
- Select the mathematical operator,
- Select the second metric and its time range (you can also input a specific numerical value in place of a metric), the metric format, and click Add again.
Here’s what it will look like in the AutomatedRules interface:
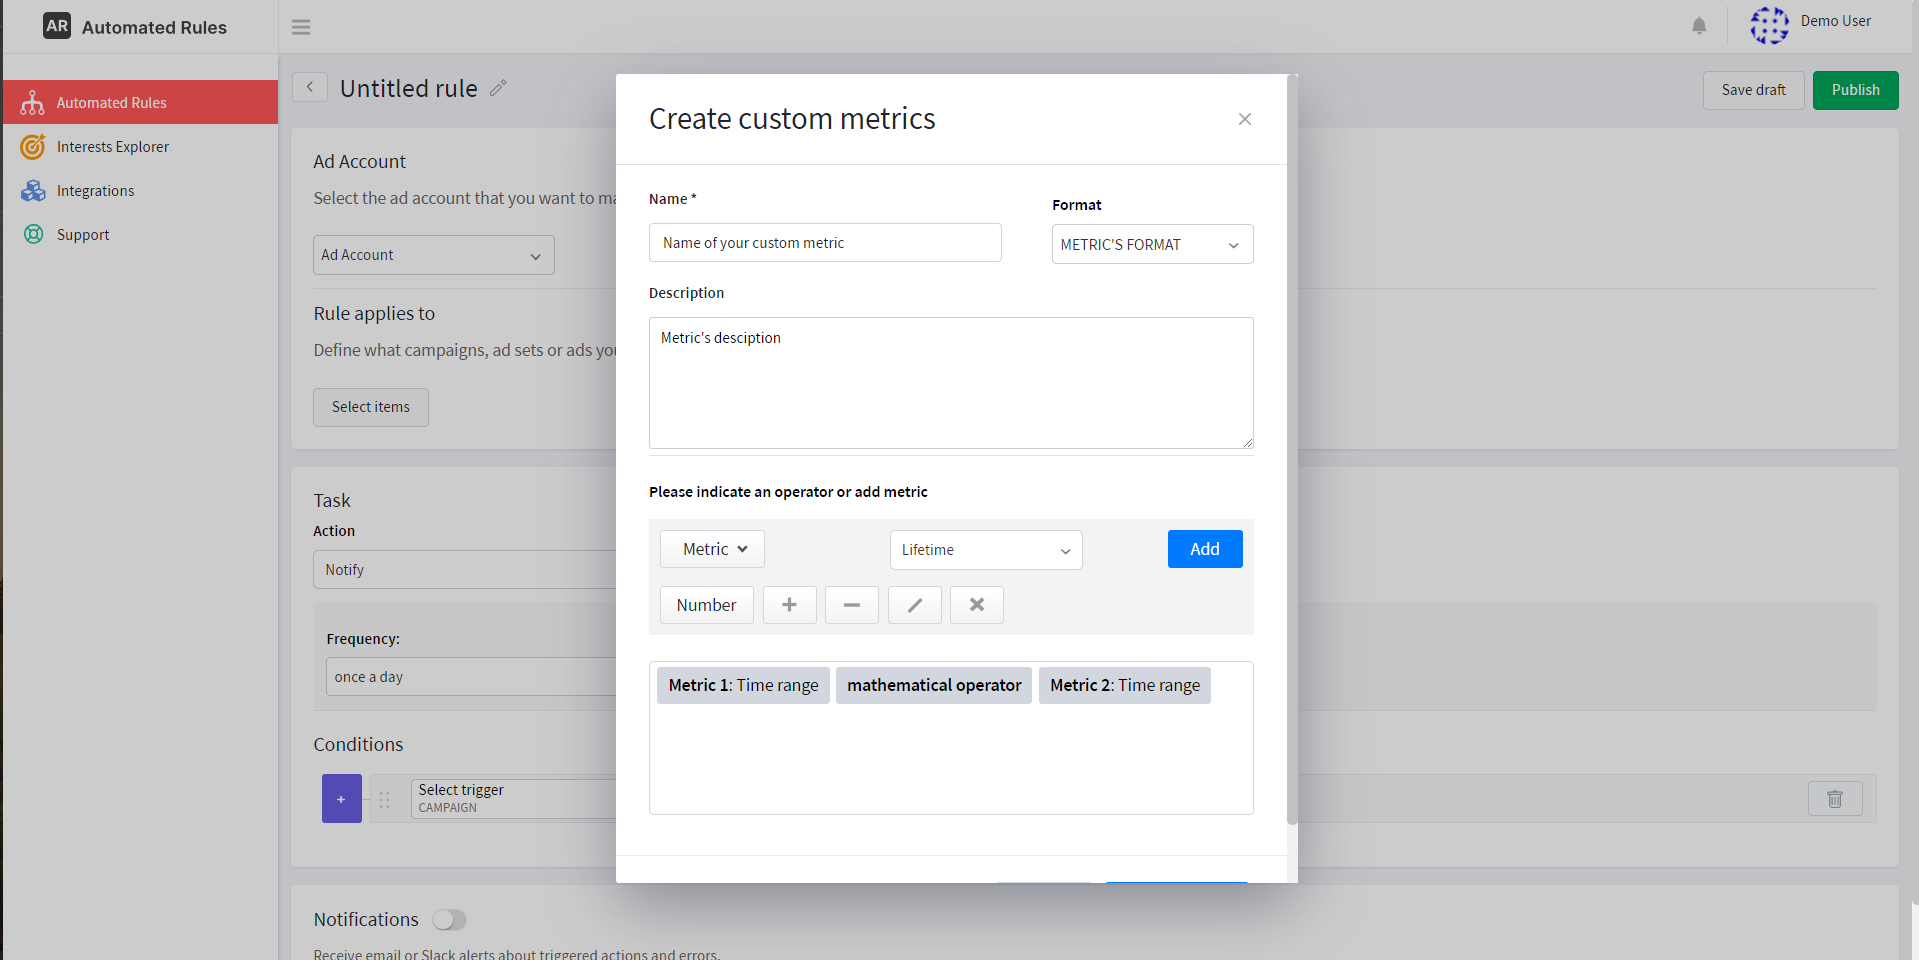
This is an example of a simple formula that includes just 2 metrics, but you can make the formula as complex as you need to by using different metrics, numerical values, and mathematical operators.
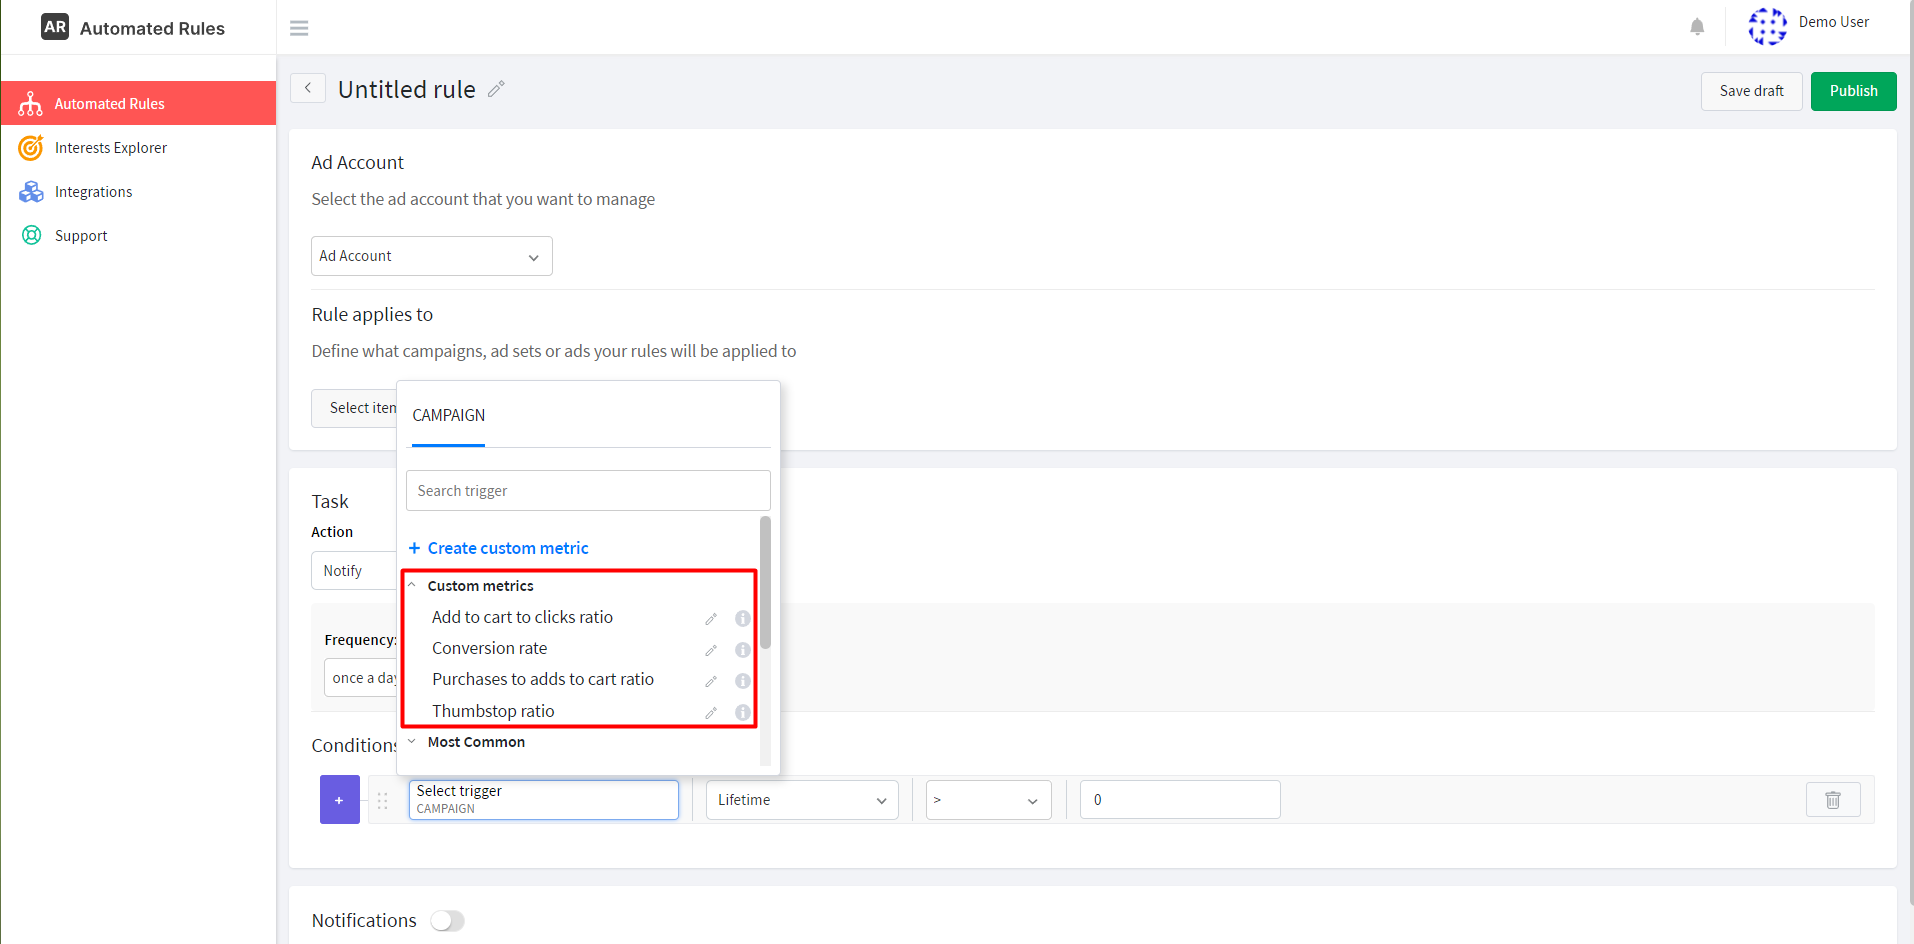
The last step we’ll need to take is to click Create Metric. Once our metric is saved, we’ll be able to choose it in the “Select trigger” section of the rule condition from the “Custom metrics” drop-down list:
Now, let’s see some common custom metrics that we can create with AutomatedRules to understand the process a bit better. For this article, we’ll focus on examples that can be useful for E-commerce businesses that sell items on their websites.
Conversion Rate (CVR)
This is one of the most widely used KPIs in digital advertising as it helps to measure the effectiveness of our ad campaigns and identify areas that need to be optimized. The CVR shows the percentage of all website visitors who completed the desired action, or, in other words, converted.
This is how we can calculate this metric:
CVR = (Number attributed conversions / Number of clicks/visits) x 100%
The higher your CVR is, the more of your website visitors make purchases, install your app, book your services, etc. after clicking on your ads. According to Gitnux, Facebook ads can generate a CVR of 9% and higher for all industries – looks promising, right? If your conversion rate is higher than that, it will indicate that your ads are quite effective in delivering the desired outcomes.
Remember that you can modify this metric to fit your needs: you can select app installs, add to cart, appointments scheduled, etc. as a conversion event in the formula.
For example, let’s say that we’re running ads for our E-commerce business and want to check how effective they are in generating new purchases. In this case, we’ll need to divide the total number of purchases by the number of clicks performed by users.
Here’s an example of how to create the CVR metric on AutomatedRules:
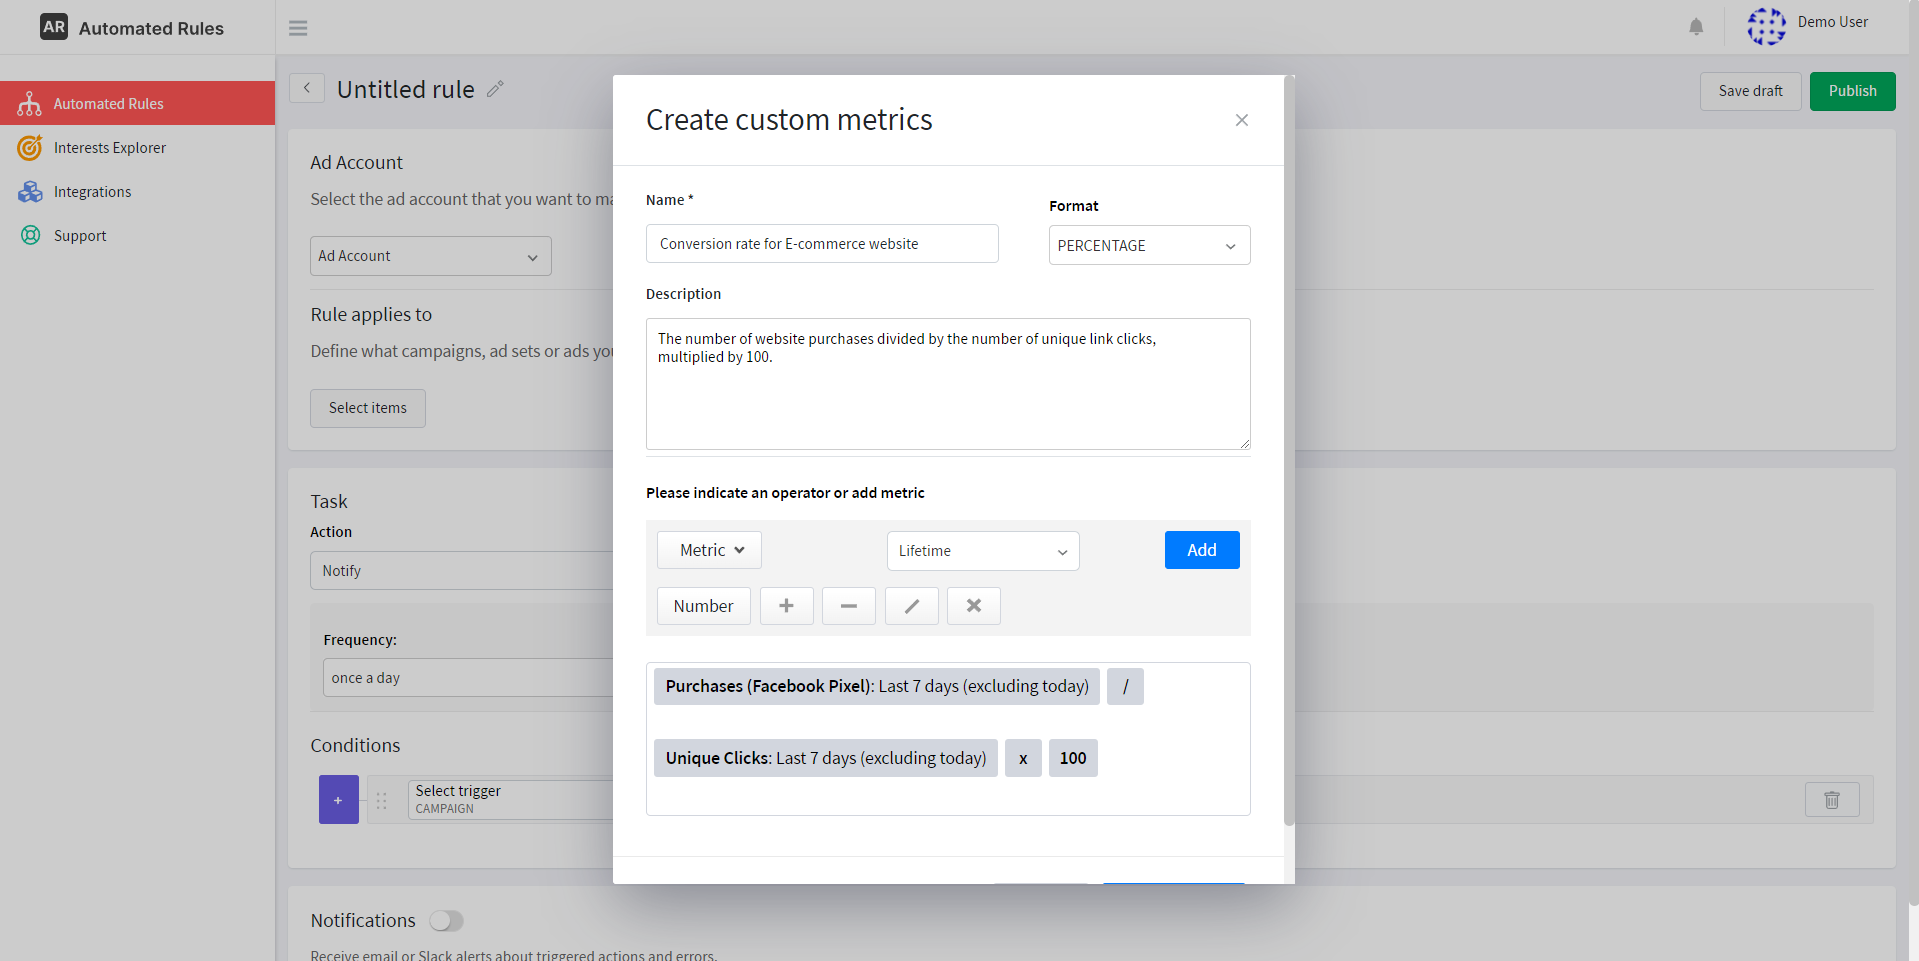
By tracking this metric, we’ll be able to see what % of ad clicks turn into purchases and evaluate the success rate of our ads.
If the CVR is lower than we expected, this might mean that our ads are not particularly relevant to our target audience and we need to consider changing our ad creatives, offers, or targeting filters.
Low CVR can also pinpoint problems with our landing pages, UX, and other elements of our website that have an impact on the purchasing behavior of our potential customers.
Add to cart rate
Another metric that we can track is Add to cart rate: it allows us to see how many people who clicked on our ads end up adding items to their carts on our website. In comparison with CVR, this metric measures results that are linked to higher levels of the conversion funnel, which means that it can be useful for assessing the performance of ad campaigns targeted at audiences that haven’t entered the “warm” category yet.
Here’s the formula we’re going to use for calculating this metric:
Add to cart rate = (Number of Add to Cart events / Number of unique link clicks) x 100%
This is how we can create this metric with AutomatedRules:

In general, an average add-to-cart rate lies between 3-4%, and anything higher than that can be indicative of the effectiveness of your ads and a good UX on your website. Note, however, that just like with any other metrics, this one might vary depending on the industry and other variables.
If this ratio is low, it might mean some of the following things:
- There are some issues on your website that prevent people from finding items based on their needs and preferences (e.g. lack of product descriptions or images, complicated navigation, poor mobile experience, etc.);
- Your offers are not appealing enough to the people you’re targeting in your ad campaigns;
- Your messaging leaves a lot to be desired, e.g. it doesn’t convey the benefits of particular products and thus fails to give people an incentive to check them out.
Tracking this metric can help you make data-driven decisions to provide better shopping experiences to your customers and ultimately drive higher conversions and revenue.
Add to cart to purchases rate
For campaigns aimed at generating more sales, you might want to choose metrics that reflect actions lower down the conversion funnel. For example, by calculating the ratio of purchases to add-to-cart events, you can see how likely people are to complete the conversion process. In a way, it’s a variation of the Conversion rate metric but for a specific case.
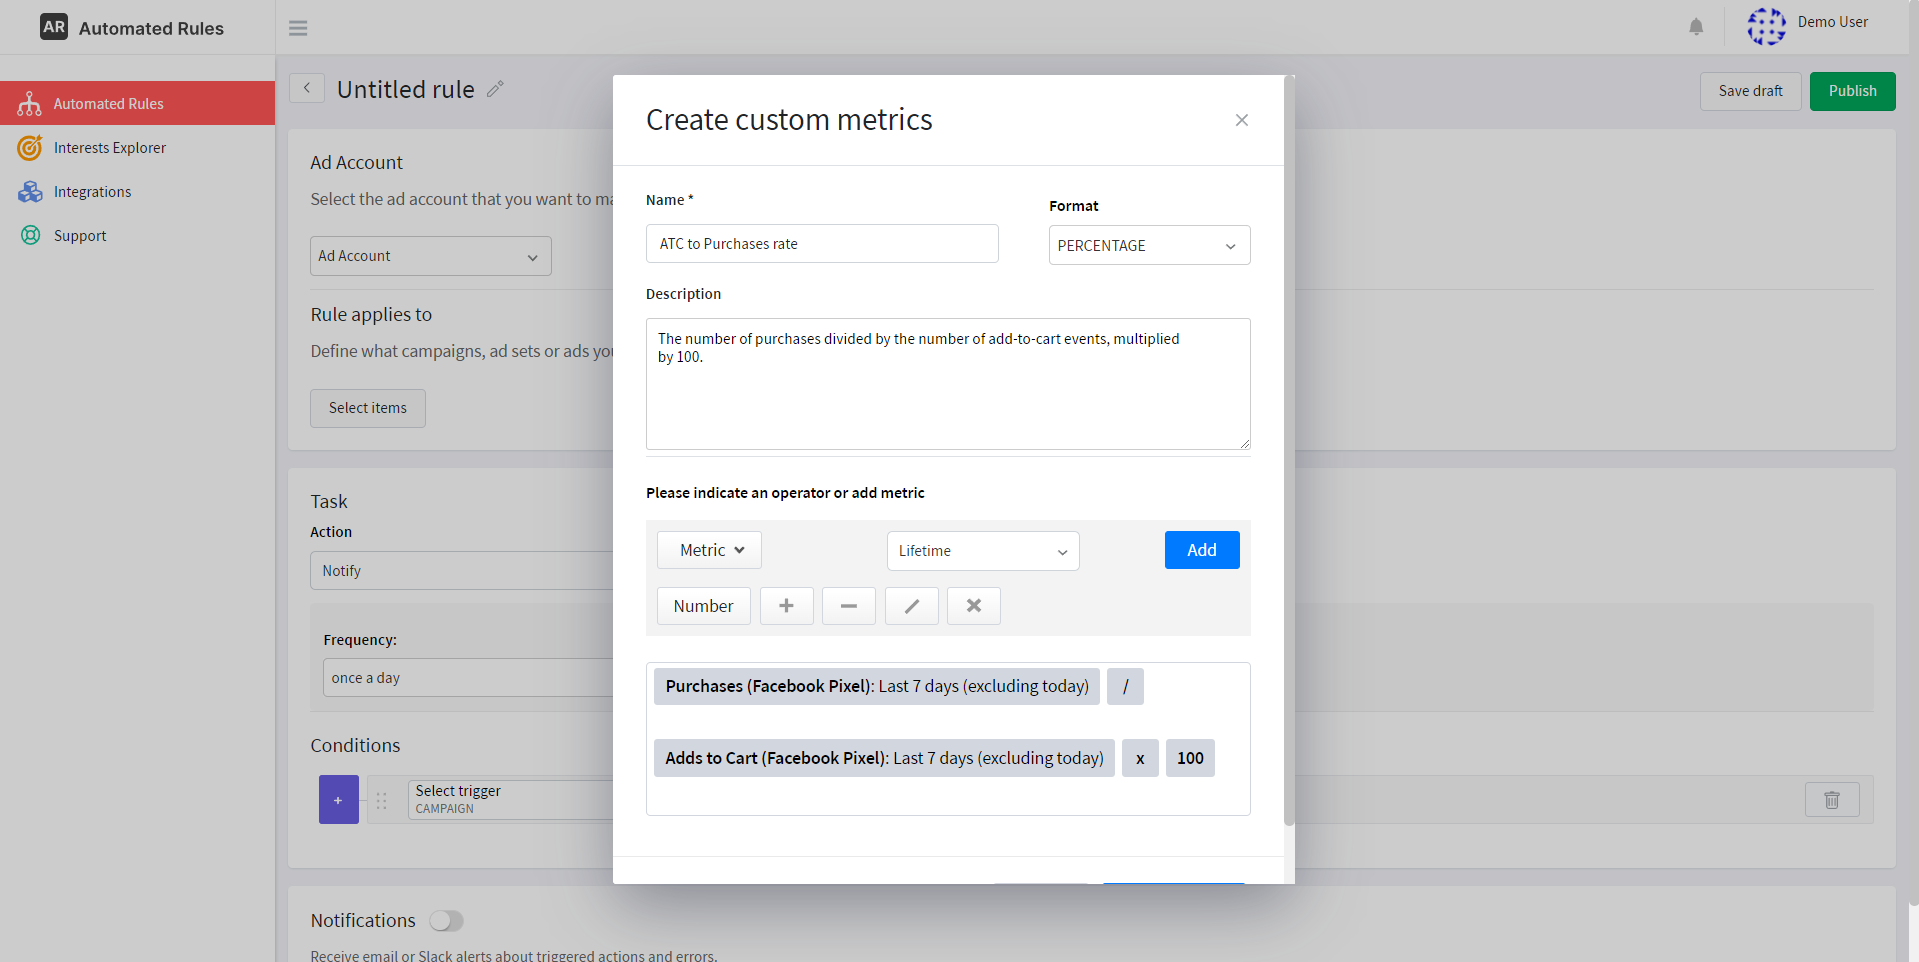
It can be calculated with this formula:
ATC to Purchases rate = (Number of purchases / Number of add-to-cart events) x 100%
Here’s how this metric can look like on AutomatedRules:
If this ratio is low, there are probably some obstacles preventing people from fully converting that you can try to eliminate. For example, it can be high prices or shipping costs, lack of shipping or payment options, and so on.
If you keep an eye on this metric, you’ll be able to optimize your ads, website, or shopping experience to maximize the potential of your E-commerce business.
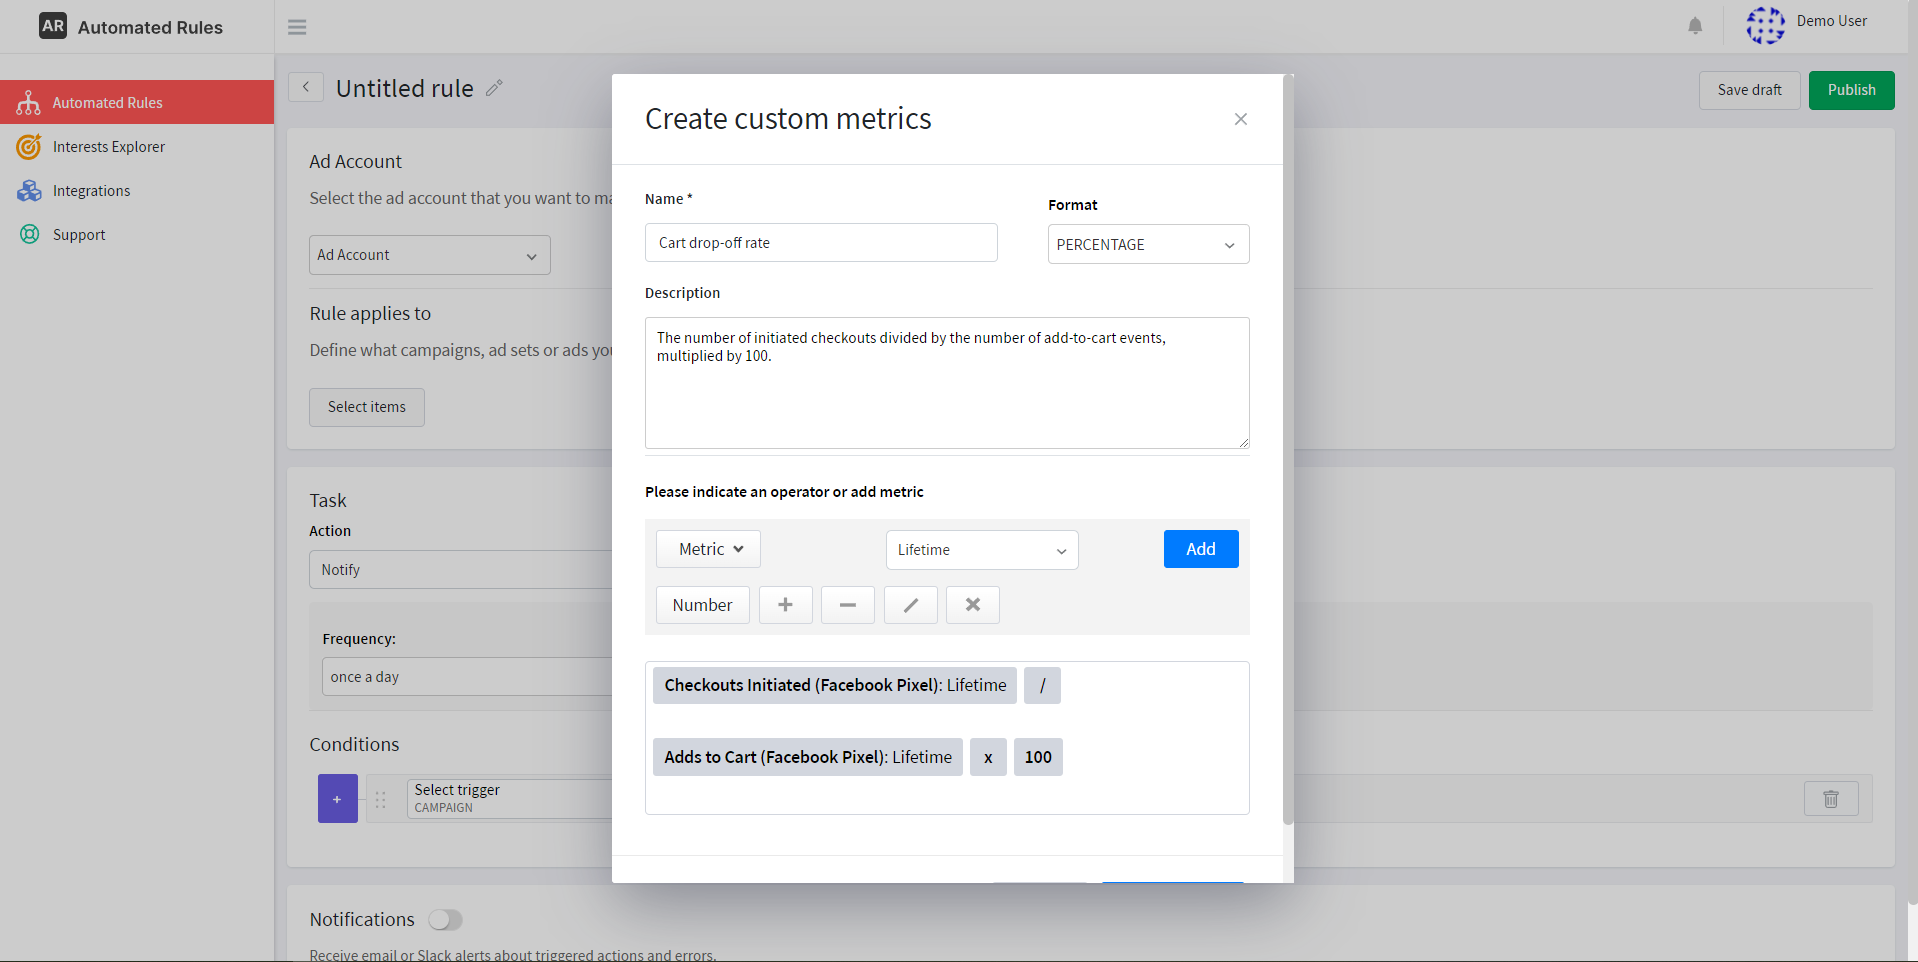
Cart drop-off rate
This is another metric that can be incredibly useful if you’re running E-commerce ads. It shows how many people end up not making the purchase after taking their time browsing items on your website and even adding them to their carts.
We can calculate this metric by using the following formula:
Cart drop-off rate = (Number of initiated checkouts / Number of add-to-cart events) x 100%
And here’s how this metric will look like on AutomatedRules:
When a lot of people take their time to look for items they like and add them to their cart but don’t end up converting, it can point to possible issues with the checkout process, delivery and payment options, ad message, offers, and so on.
Identifying the possible causes of high cart drop-off rates can help you find ways to incentivize people to become paying customers.
Click Quality
If you’re running ads that drive traffic to your website, you’re obviously paying attention to how many clicks you get. But besides measuring just clicks quantity, it can also be helpful to keep an eye on their quality. After all, if people don't bother to stay on your website after clicking on your ads, even a high number of clicks won't help you generate conversions.
To check the quality of your clicks, you can create custom metrics that measure user engagement beyond the initial click. For example, we can use the following formula:
Click quality = (Number of results ) / Number of clicks) x 100%
Depending on the objective of your campaign, the “results” in this formula can look different for each case: you can select the number of registrations completed, adds to the cart, leads, content views, and so on. In a way, this metric is similar to the Conversion rate, but it can be used for measuring the percentage of clicks that generate actions suitable for higher levels of the conversion funnel.
Here’s how this metric can be created on AutomatedRules:
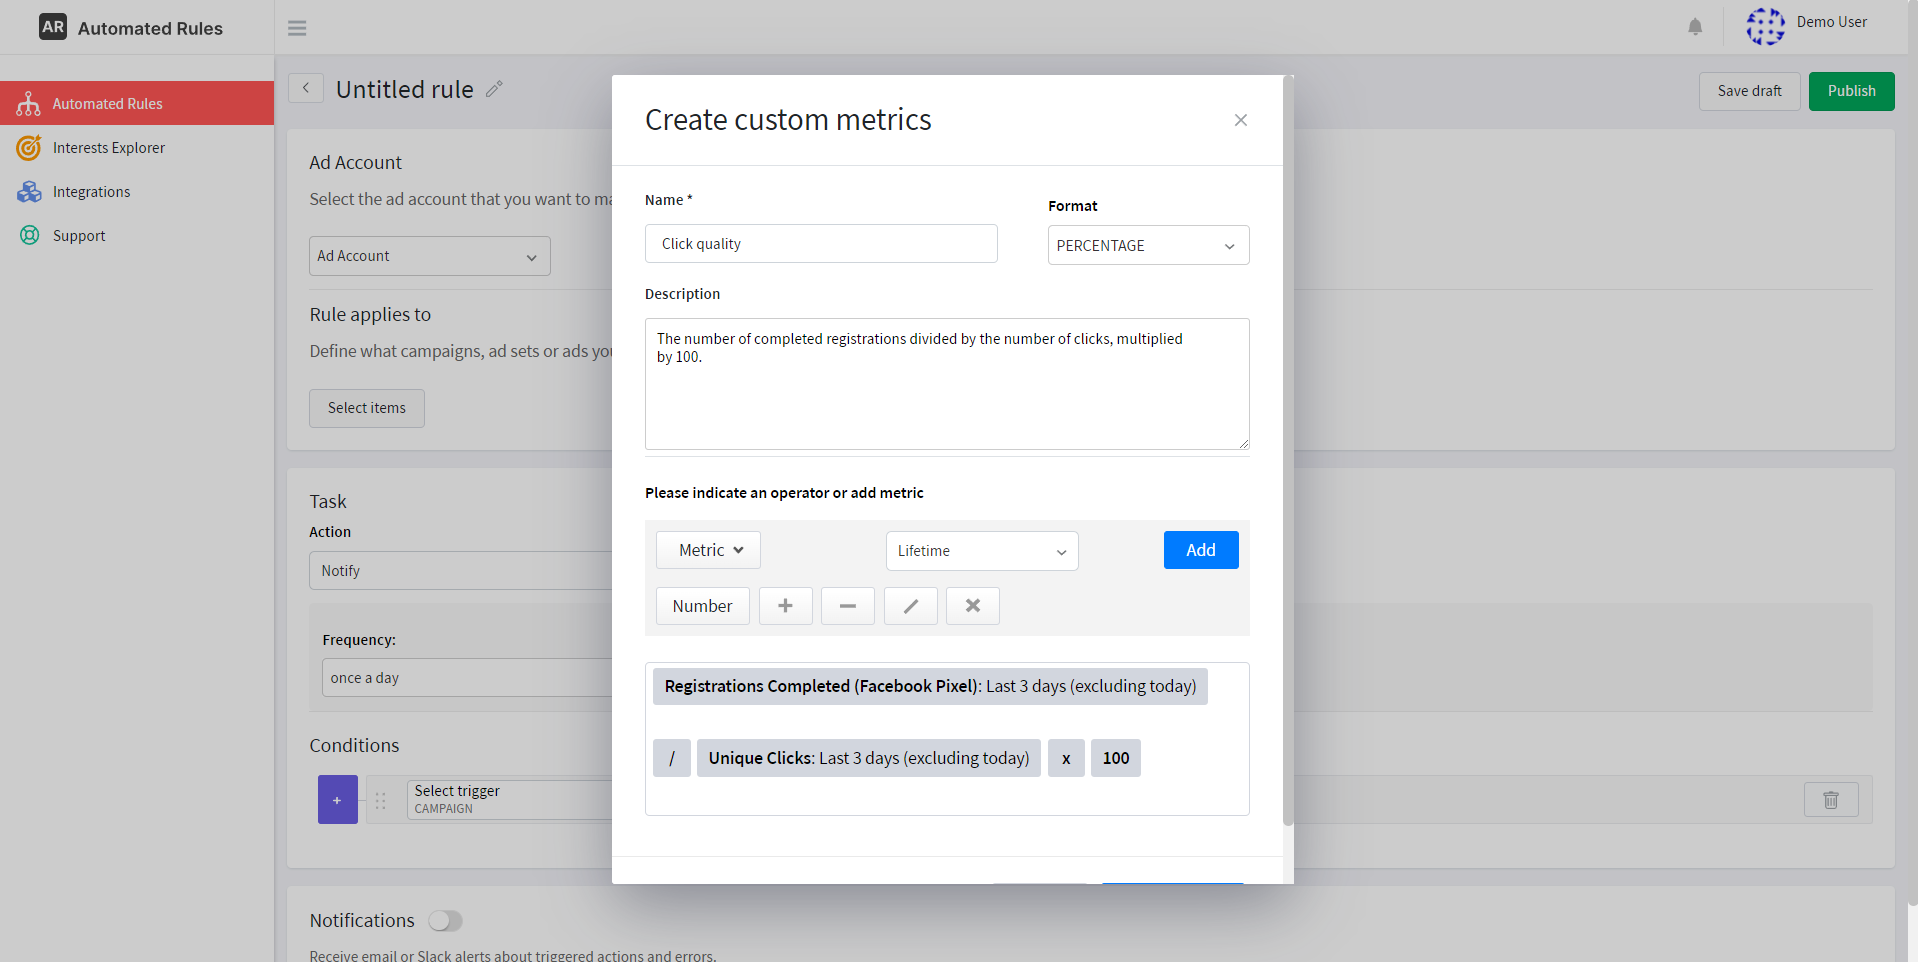
This custom metric will reflect the quality of traffic sent by the ads to your website by measuring the percentage of registrations you get from clicks. The low percentage can be caused by many reasons:
- Your ads are not relevant enough for your target audience;
- There’s an inconsistency between the offers in your ads and offers on your website;
- The registration process is too complicated or there are other issues with user experience;
- Your website is not optimized for mobile viewing;
- There are not enough incentives to sign up on your website.
If you regularly monitor the quality of your ad clicks, you’ll be able to pinpoint possible issues with your ads or website and take the necessary steps to get more people to take the desired action.
Thumbstop Rate
If you’re actively using video format in your ad campaigns, you need to know how effective your ads are in attracting users’ attention. One metric that can help you with this is the Thumbstop Rate which can be calculated this way:
Thumbstop rate = (3-second video plays / Impressions) x 100%
Here’s how this metric can be created with AutomatedRules:
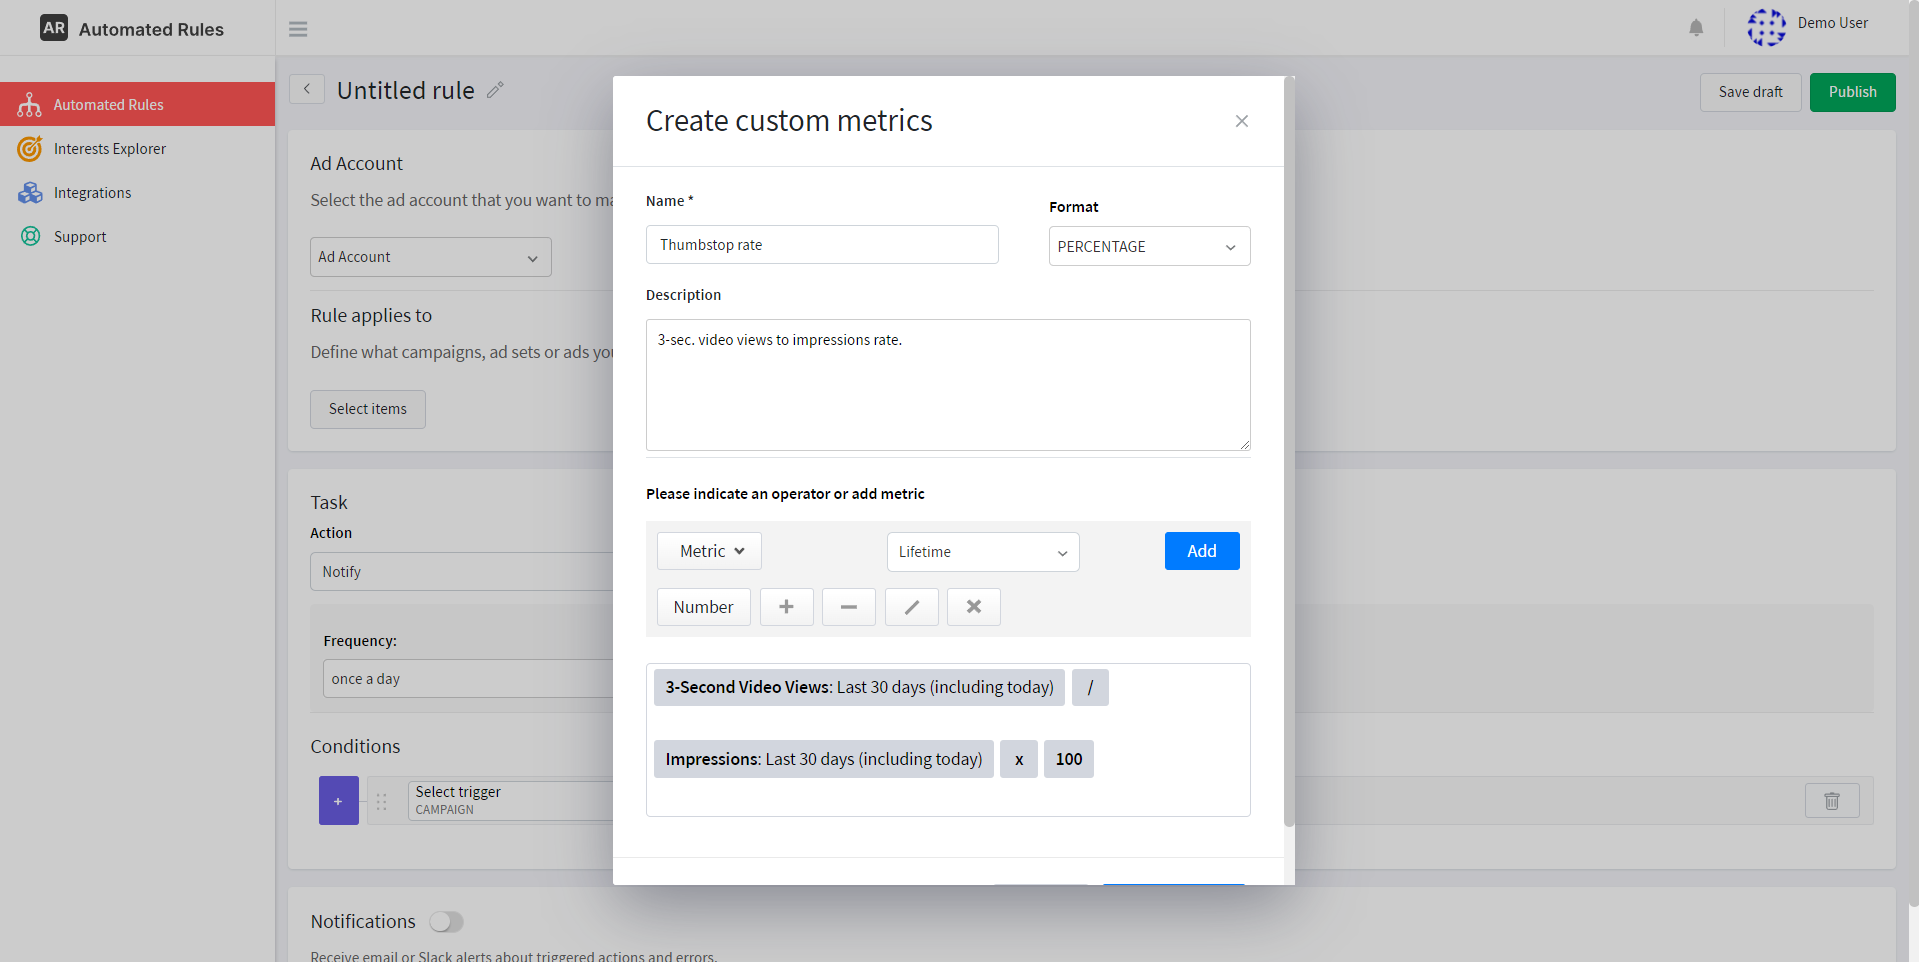
This metric will indicate how engaging your video ad is within the first few seconds. A higher thumbstop rate means that viewers were compelled to stop scrolling and take some time to watch your ad.
If it is low, though, it could indicate that your video content isn't capturing viewers' attention quickly enough – in this case, you’ll need to work on your ad to make sure it’s as engaging as possible for your audience.
Engagement rate
This metric can be helpful if you’re running ad campaigns aimed at generating more engagement: it will help you assess the effectiveness of your ads in terms of user interaction with them.
You can calculate this metric by using the following formula:
Engagement score = Post Engagement / Impressions
And here’s how you can create it on AutomatedRules:
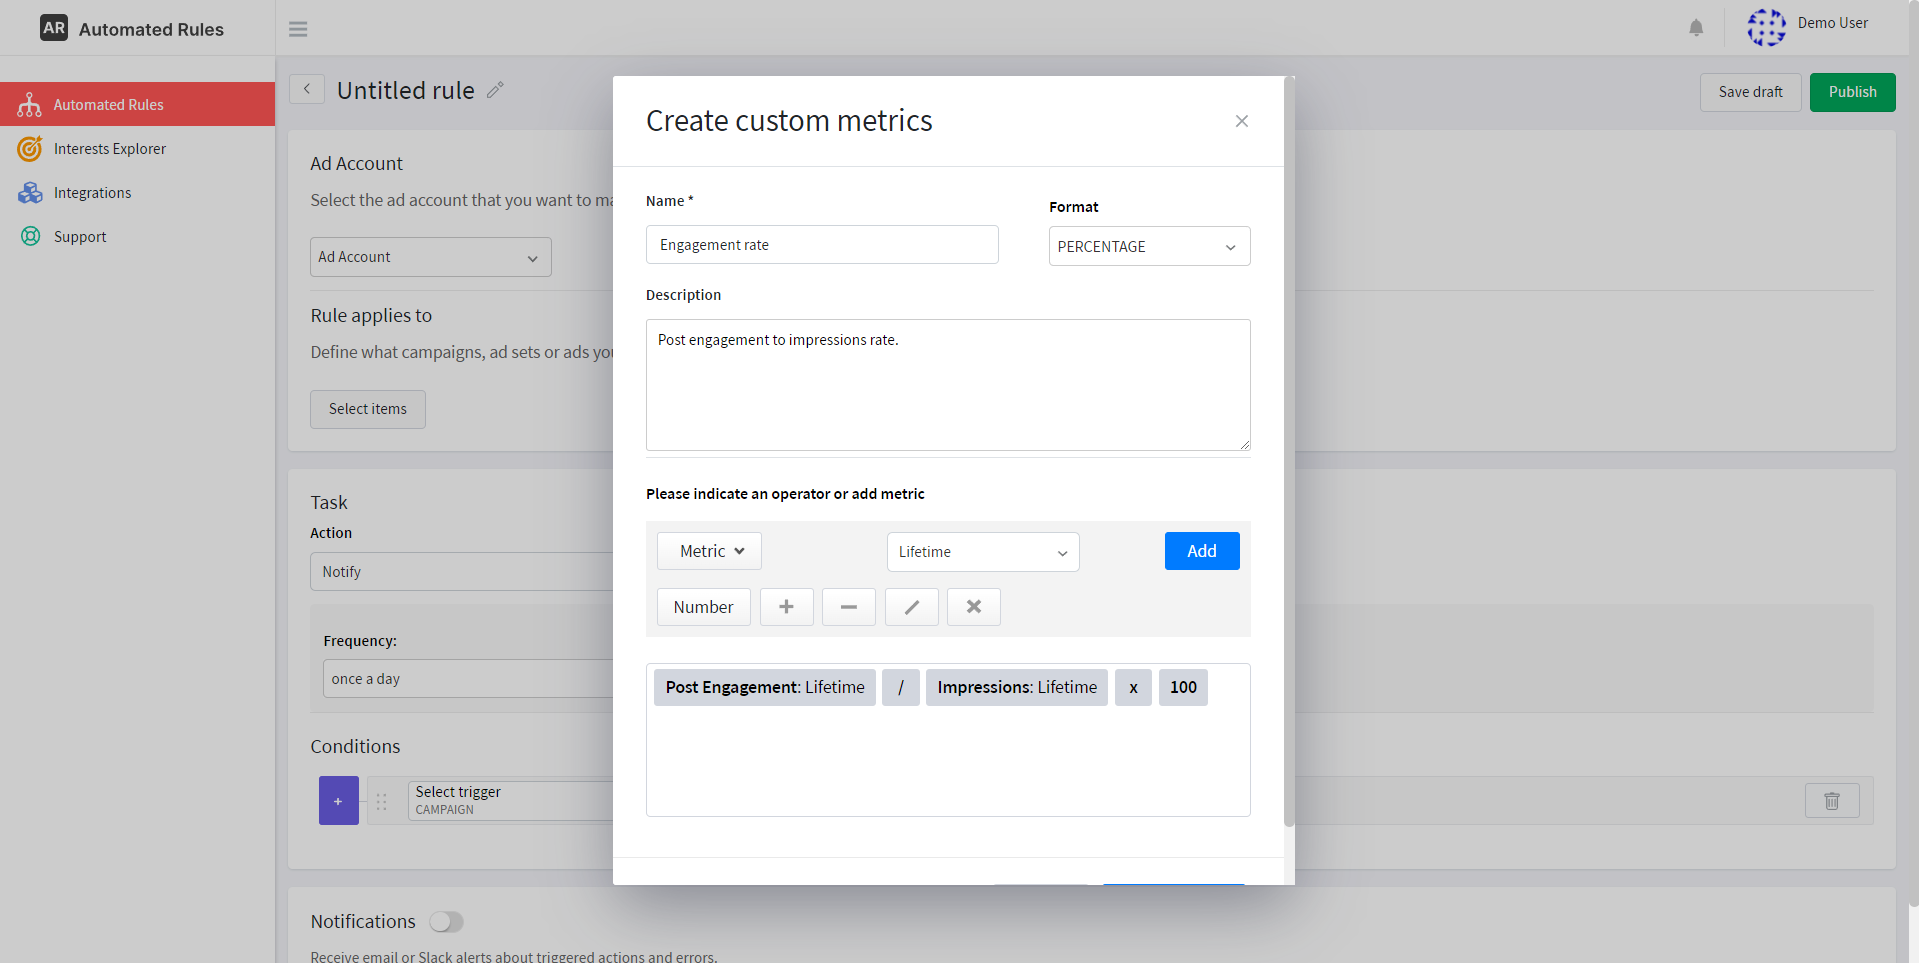
If your Engagement rate is high, it means that the content of your ads resonates with your target audience and users are more likely to interact with it. If it is low, however, you might want to re-evaluate your creative choices and do more thorough research on the preferences of specific audience segments.
Conclusion
Hopefully, by now you can see the potential of using custom metrics for managing your Facebook ads. Harnessing this potential can become a real game-changer: by crafting tailored metrics that align with your unique goals, you're not just tracking data; you're creating a pathway to future success.
As you embark on the journey of customization, keep in mind that each campaign may require a distinct set of KPIs, and your task is to figure this out – the rest can be done with AutomatedRules. If you’re ready to transform your ad management process, sign up for a 30-day free trial today and watch as your Facebook ad campaigns ascend to new heights.
Need some help or have questions? Book a demo with our Customer Success Team or contact us to start your marketing automation journey.